2025 Temporary Public Art for the City of Nanaimo
By Kiranjot Kaur
Project Background
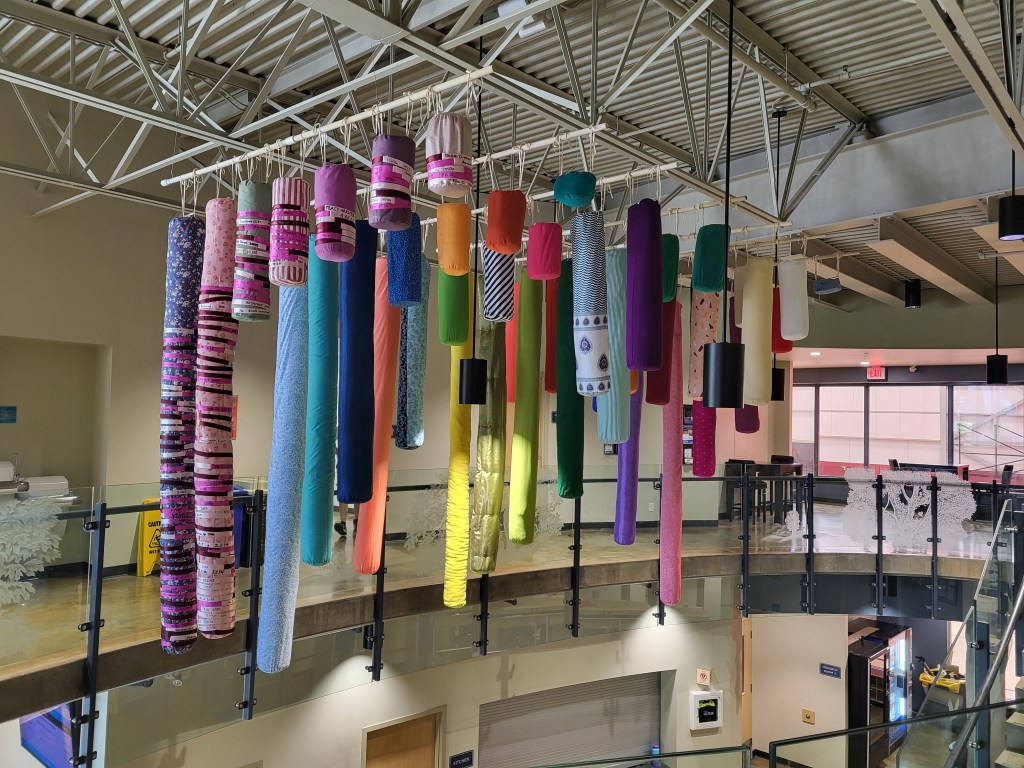
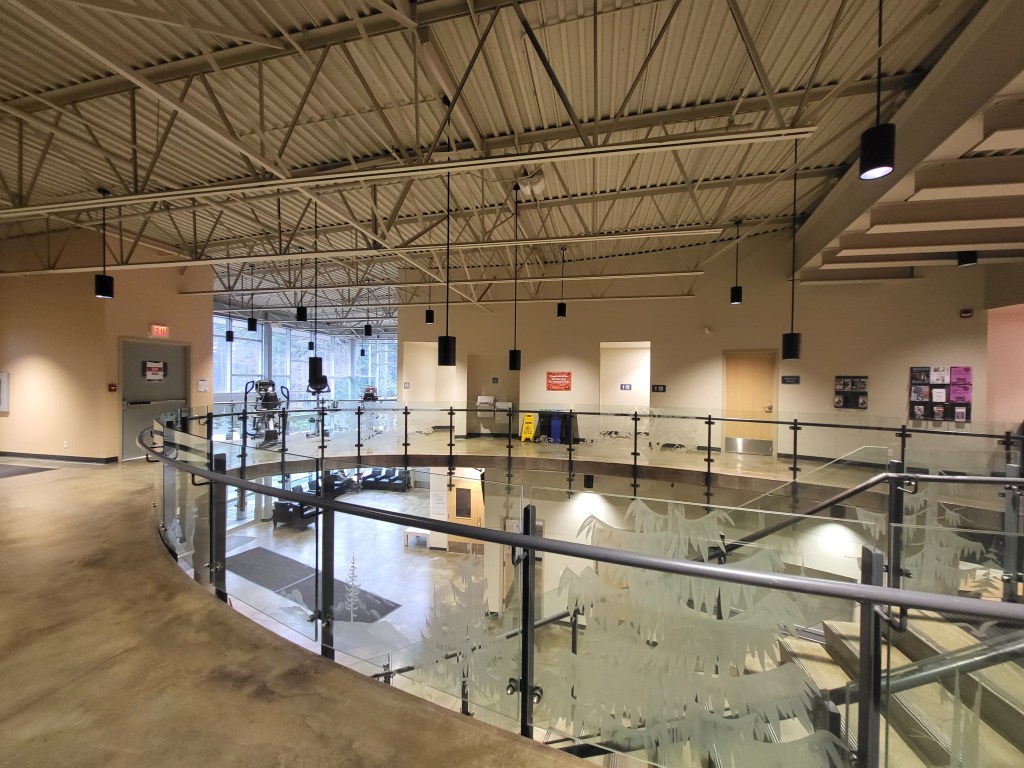
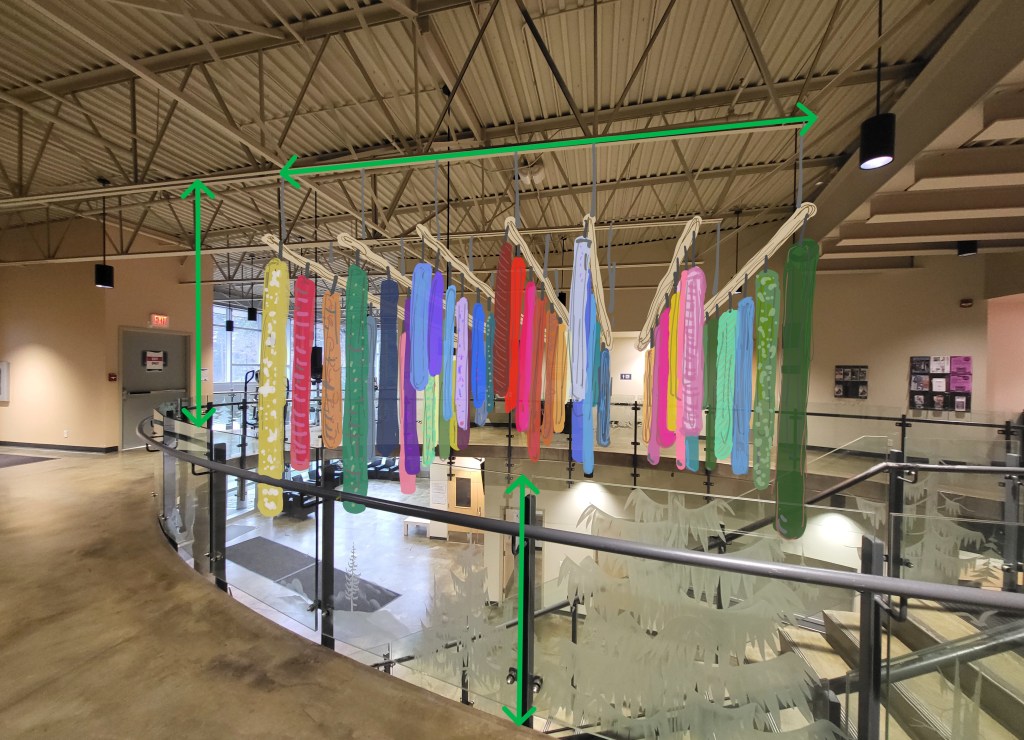
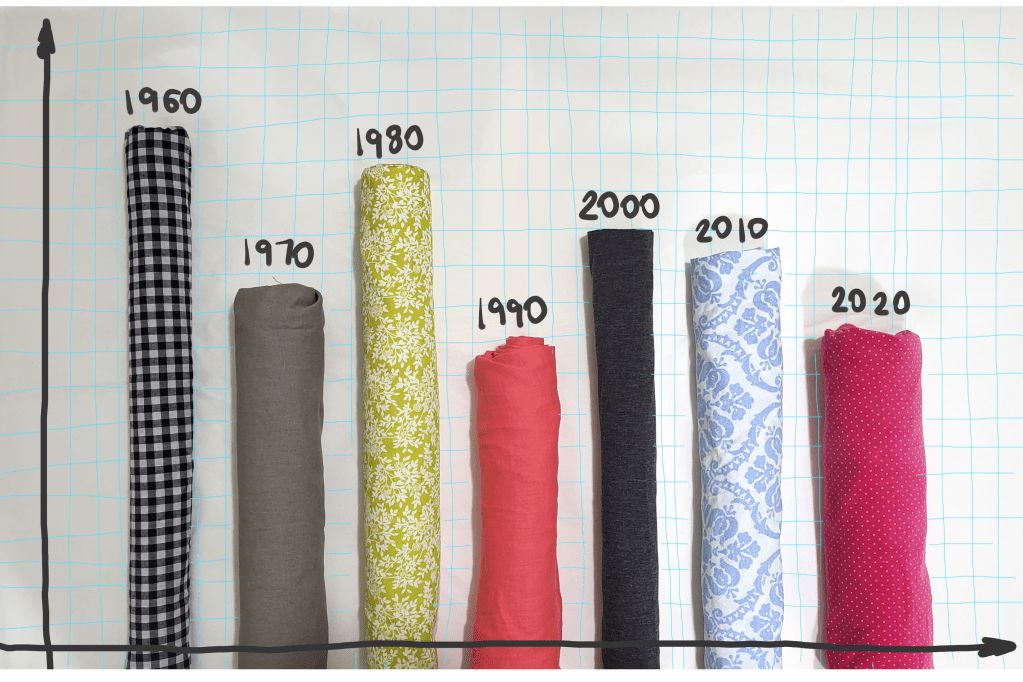
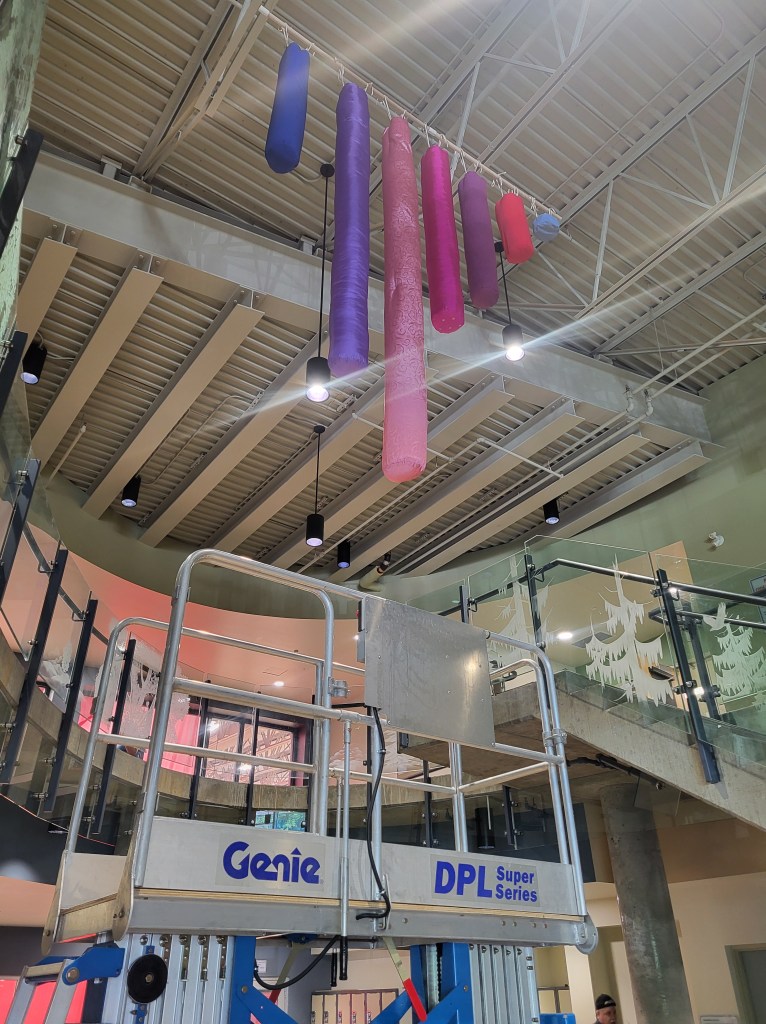
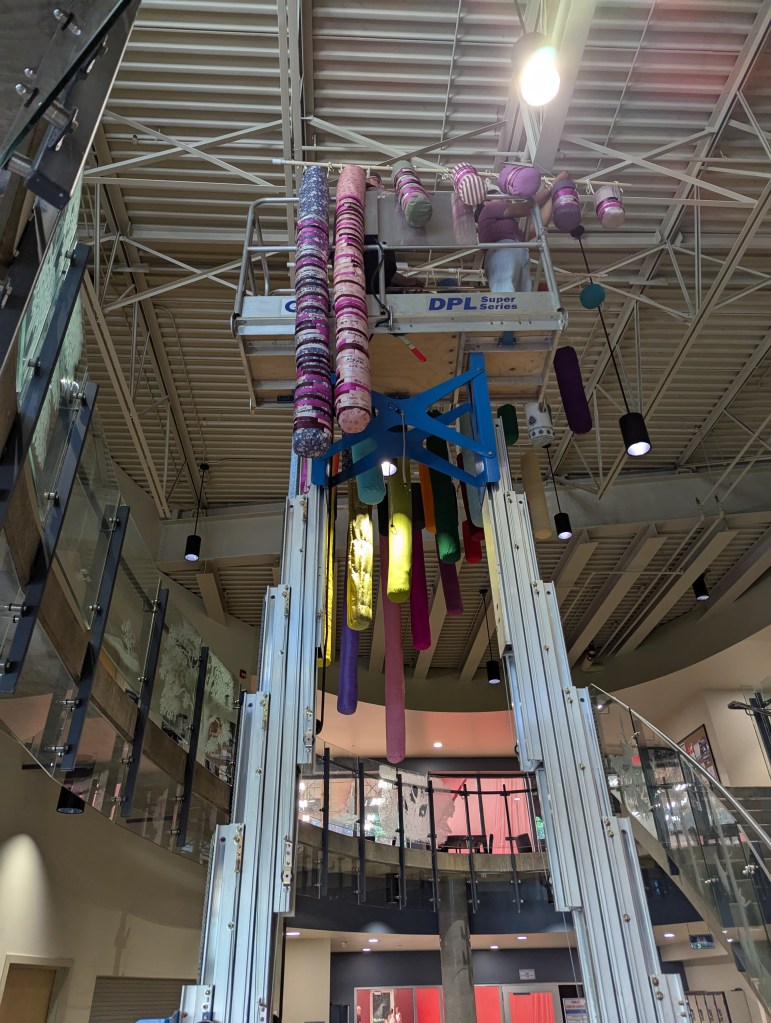
“Histogram histories” is a dynamic hanging installation representing graphs tracing the change in seven metrics across the City of Nanaimo through time, installed in the atrium of the Oliver Woods Community Centre. A histogram is a chart that plots the distribution of numeric variables in a set of bars.
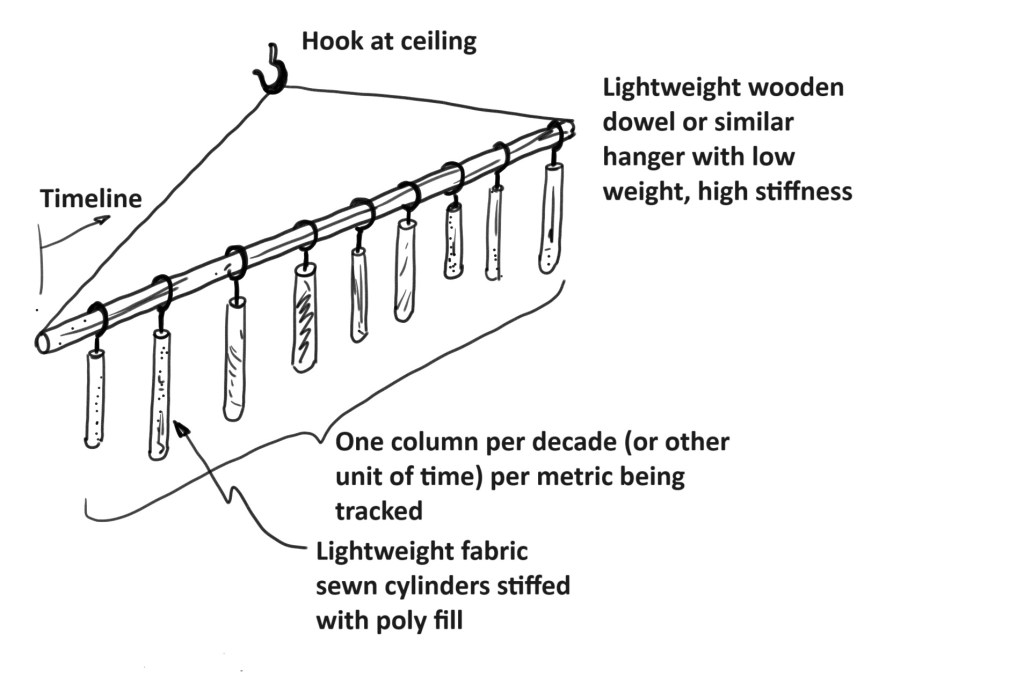
Lightweight fabric cylinders representing the metrics hang in a series of sculptural ‘graphs’, affording visitors multiple viewpoints and changing perspectives, wherein they experience the selected statistical data in visually-arresting artistic form. The cylinders are enclosed in layers of vibrant fabric of varying textures and prints for a dynamic sculptural quality.
In the realization of this project, the artist bridges gaps between disciplines, providing connections that foster community conversations and contemplation, and engaging the public in new ways of understanding our changing environment and representations of living history. The project will be installed in June 2025 and on display for public engagement and enjoyment for up to five years.
Media:
https://www.nanaimo.ca/NewsReleases/NR250710CityOfNanaimoUnveilsTemporaryPublicArtInstallation.html
Data
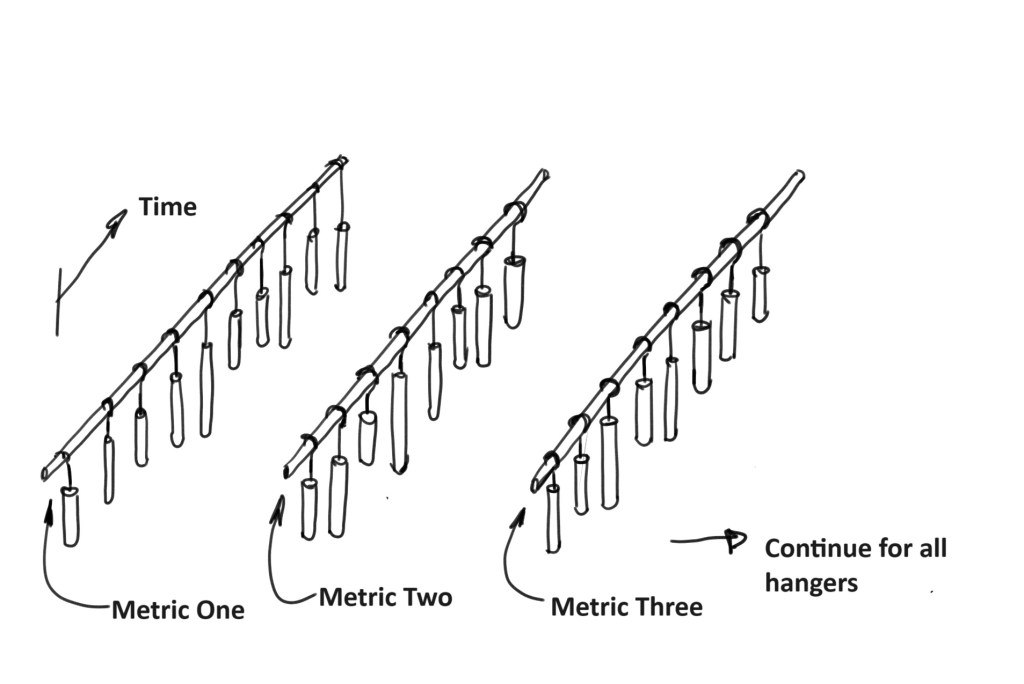
The data represented in the art installation include information for the following metrics for Nanaimo, measured by decade from the 1960s to now:
- Population
- Number of languages spoken
- Maximum extreme temperature
- Minimum extreme temperature
- Number of restaurants
- Number of Chinook
- Arrival Patterns
Details of the above metrics, along with sources of data are described below. It is important to note that the data are based on readily available information that has been categorized according to municipal and census boundaries, which may not reflect our understanding of “Nanaimo”, both geographically and as a community of residents. It is also important to acknowledge that historical data collection may have excluded aspects of the community and as such, please regard the information as approximate only. Although the graphs show trends and snippets of information, they are not telling the whole story, which of course, belongs to the residents.
As scientists, we use data to measure and create models to predict, plan and understand people, nature, events, etc. We offer explanations of limitations and caveats as part of our data collection efforts, but we don’t always go beyond acknowledgements. As artists and as consumers of art, we approach interpretation of reality through emotional response and intuition, with subjectivity. Here, by presenting demographic, cultural and environmental data through art, I am hoping to engage the community with data, data collection and data presentation to think more intuitively about the depicted trends, and the kind of information that is both included and excluded throughout the process of historical story-telling through data.
As another note, since we are still in the “2020s” decade, any data for this decade is incomplete.
Many thanks to the staff at the Nanaimo Archives including Christine and Gillian who graciously assisted in finding data and offered ideas for metrics of interest.
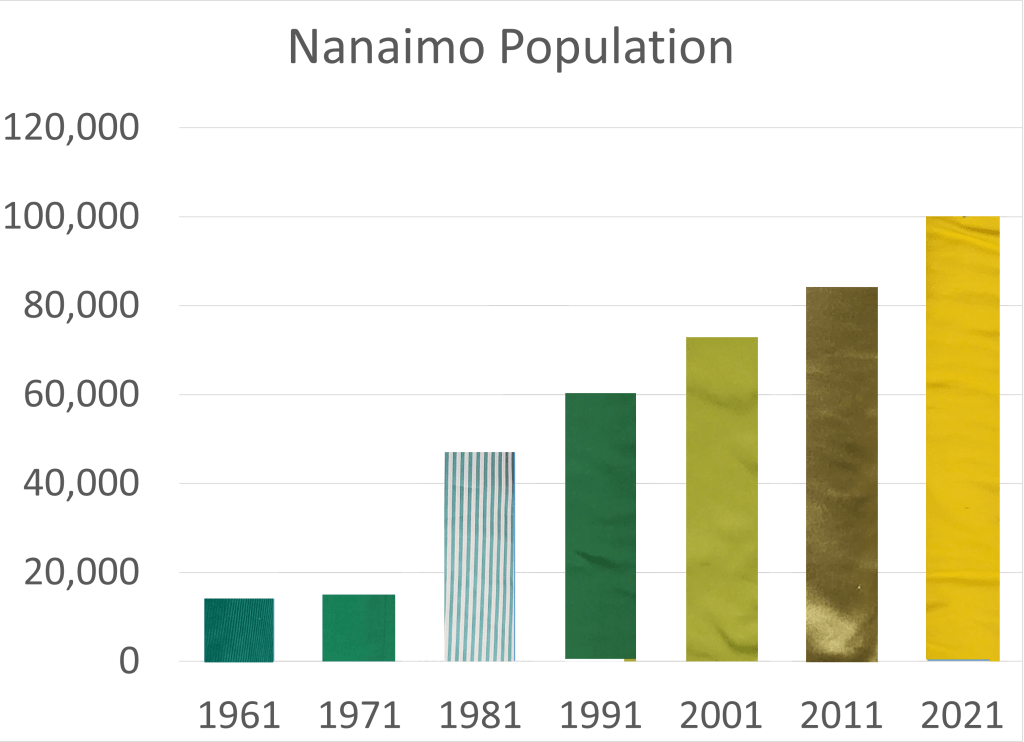
1. Population
Population for Nanaimo was determined from census records according to https://www2.gov.bc.ca/assets/gov/data/statistics/people-population-community/population/municipal_census_pop_1921_2021.pdf
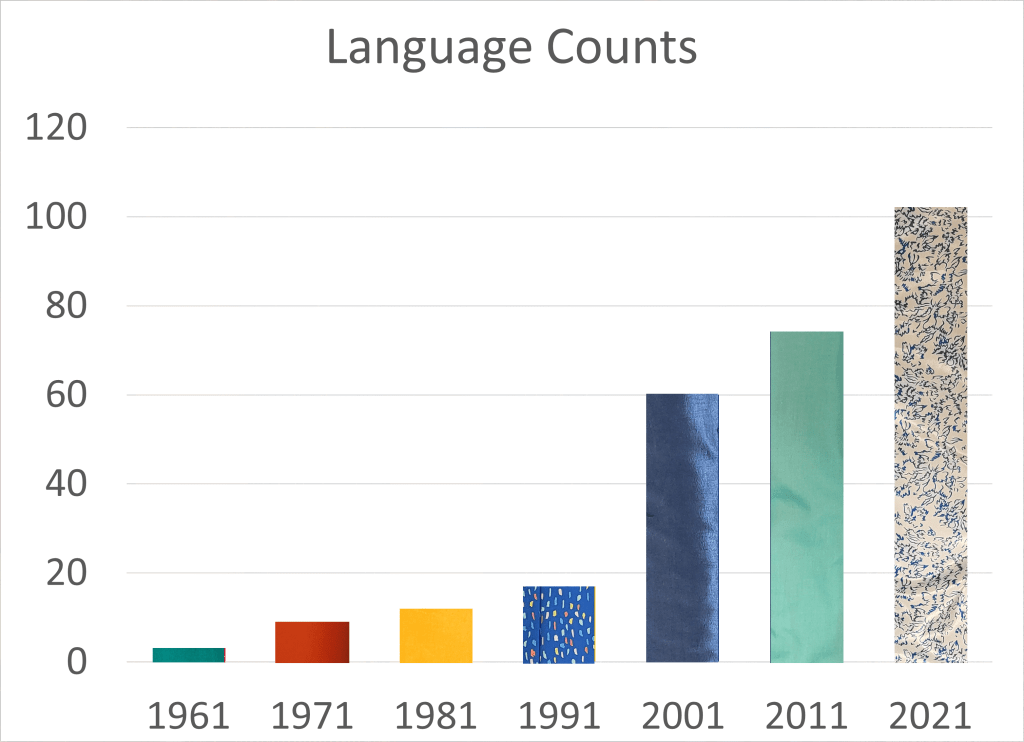
2. Number of Languages Spoken
The number of languages spoken data was obtained through census records. In earlier versions of the census, the only limited options for language selection were offered. The “other” selection likely represented many different languages but because of the way the question was asked, we are unable to readily find accurate information for the number of languages spoken.
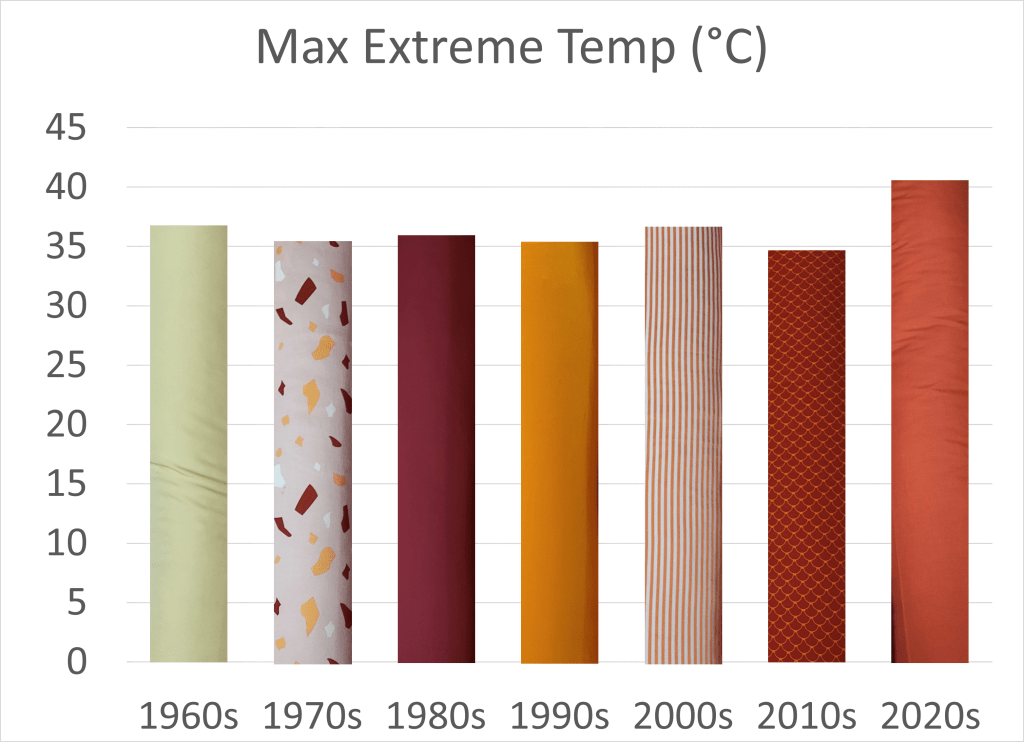
3. Maximum Extreme Temperature
Weather data were accessed from the Government of Canada’s weather data, available online at: https://climate.weather.gc.ca/index_e.html
Temperatures are expressed in degrees Celsius and represent the maximum recorded temperature per decade, based on monthly reported temperatures at Station Nanaimo A from the federal climate data, until 2007. Data reported after 2007 are based on the information provided at https://nanaimo.weatherstats.ca/.
4. Minimum Extreme Temperature
Similar to above, the minimum extreme temperatures, reported in degrees Celsius.

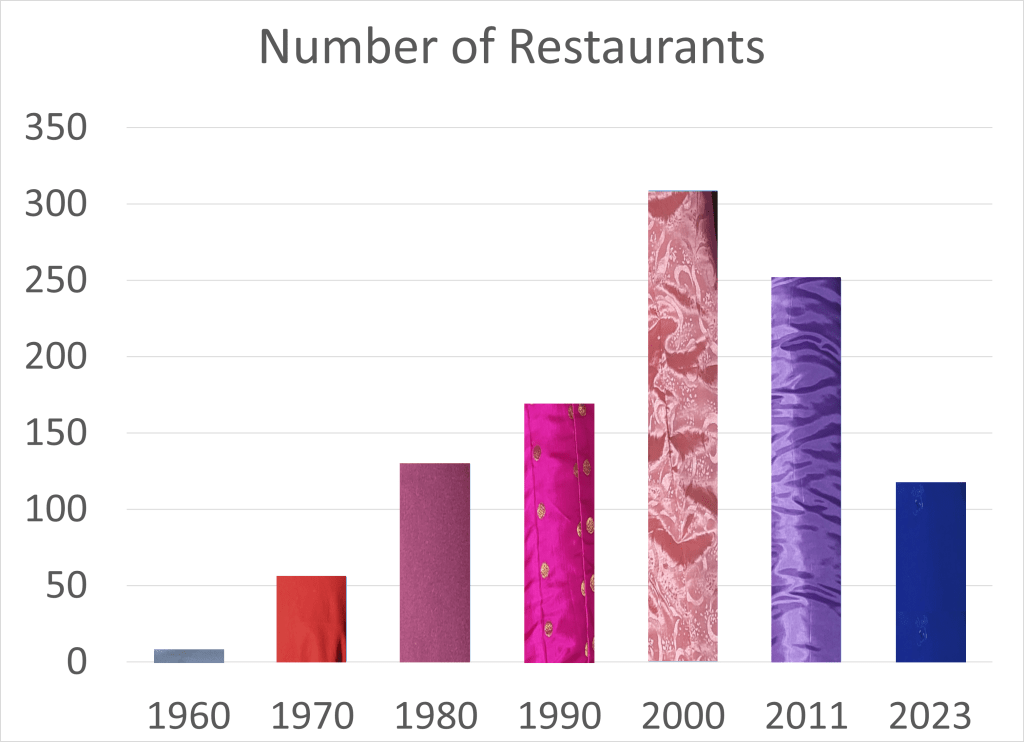
5. Number of Restaurants
The number of restaurants is based on restaurants listed in the Yellow Pages (excluded are any restaurants that were or are unlisted, which has likely increased over time).
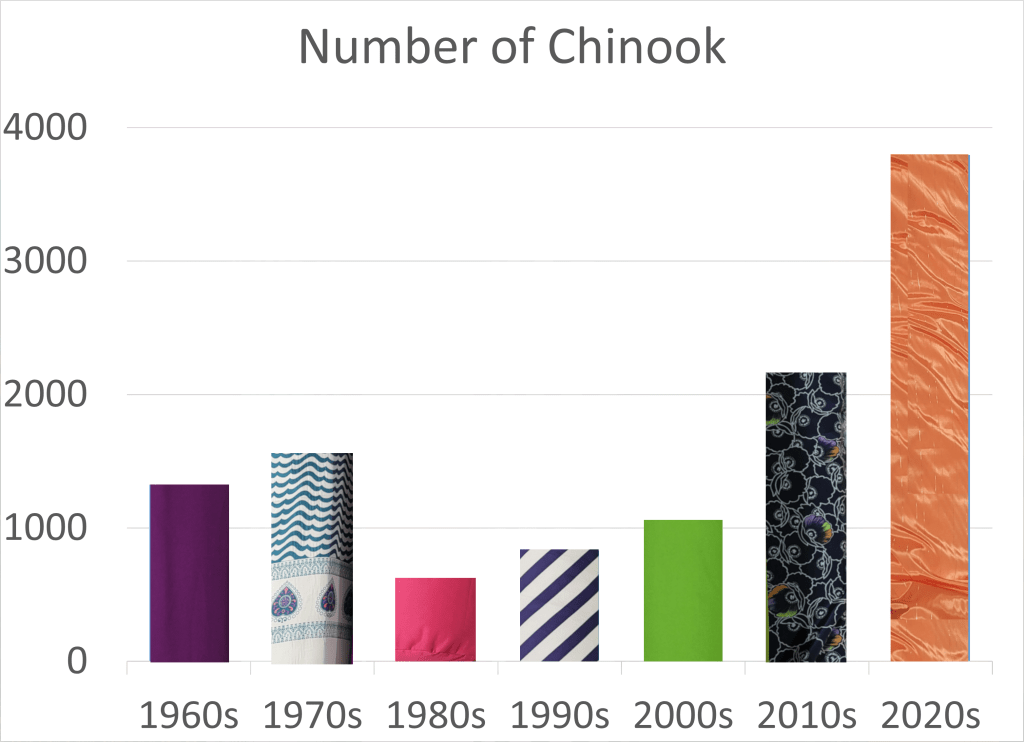
6. Number of Chinook
The number of chinook is based on a count of the average adult spawners counted in Nanaimo River per decade.
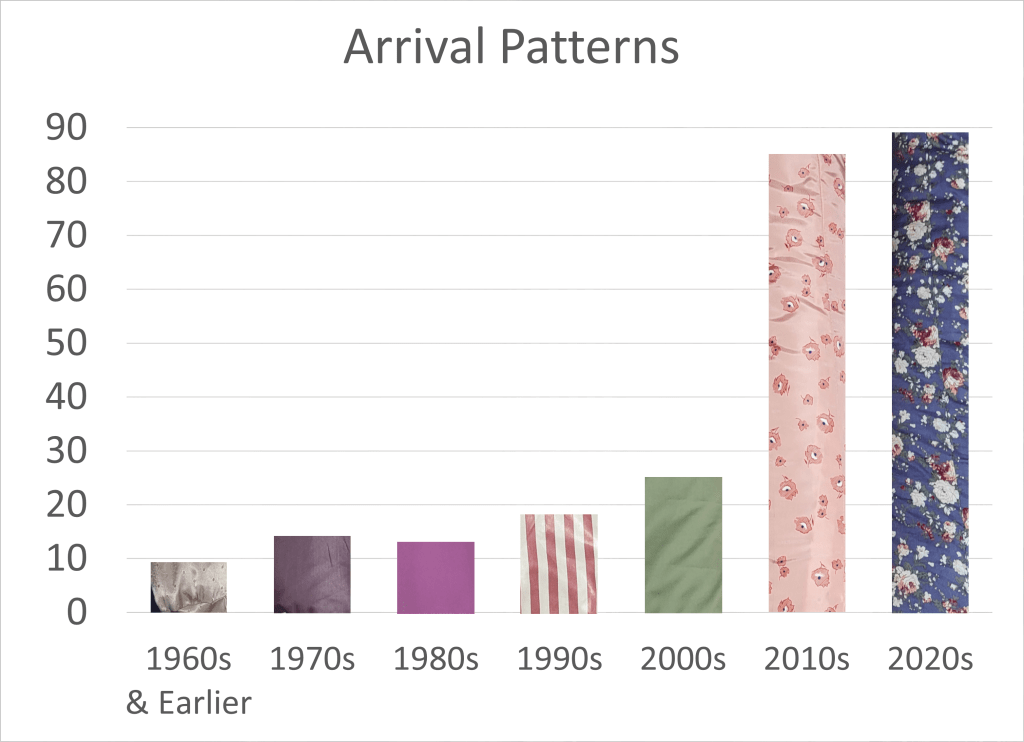
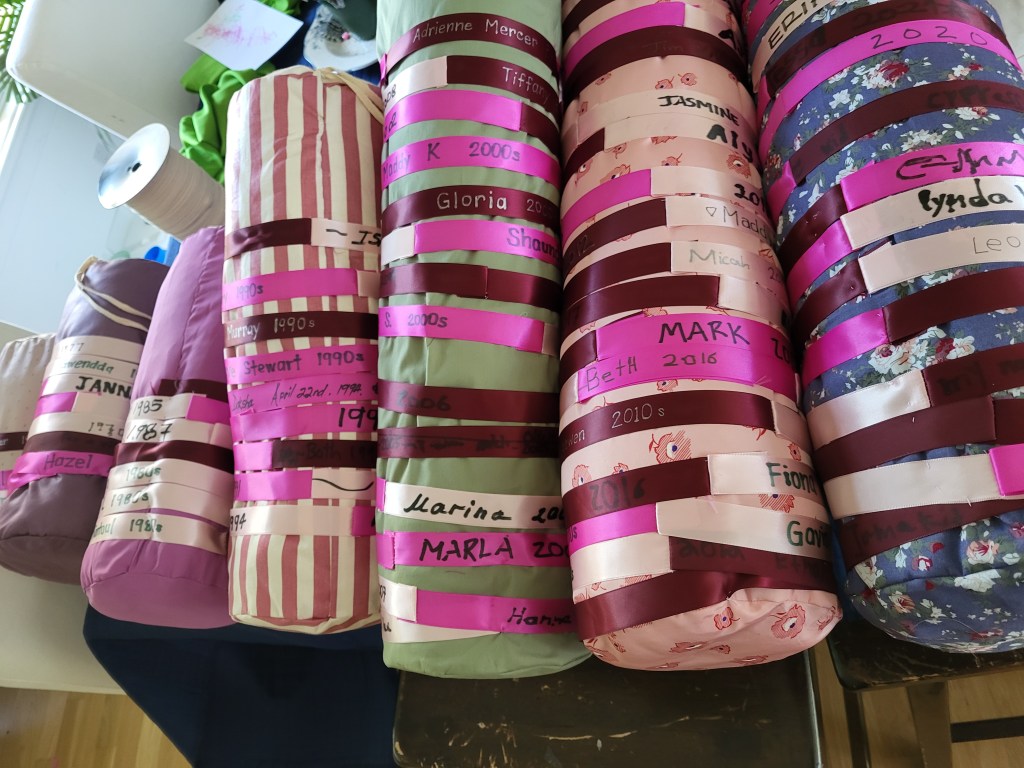
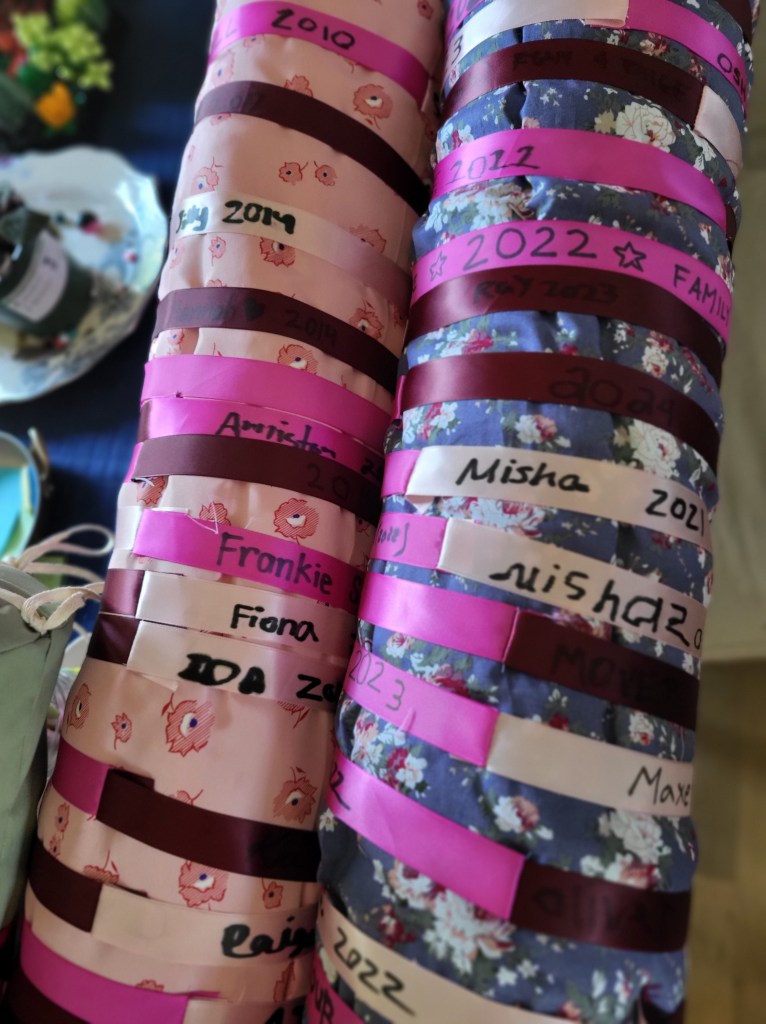
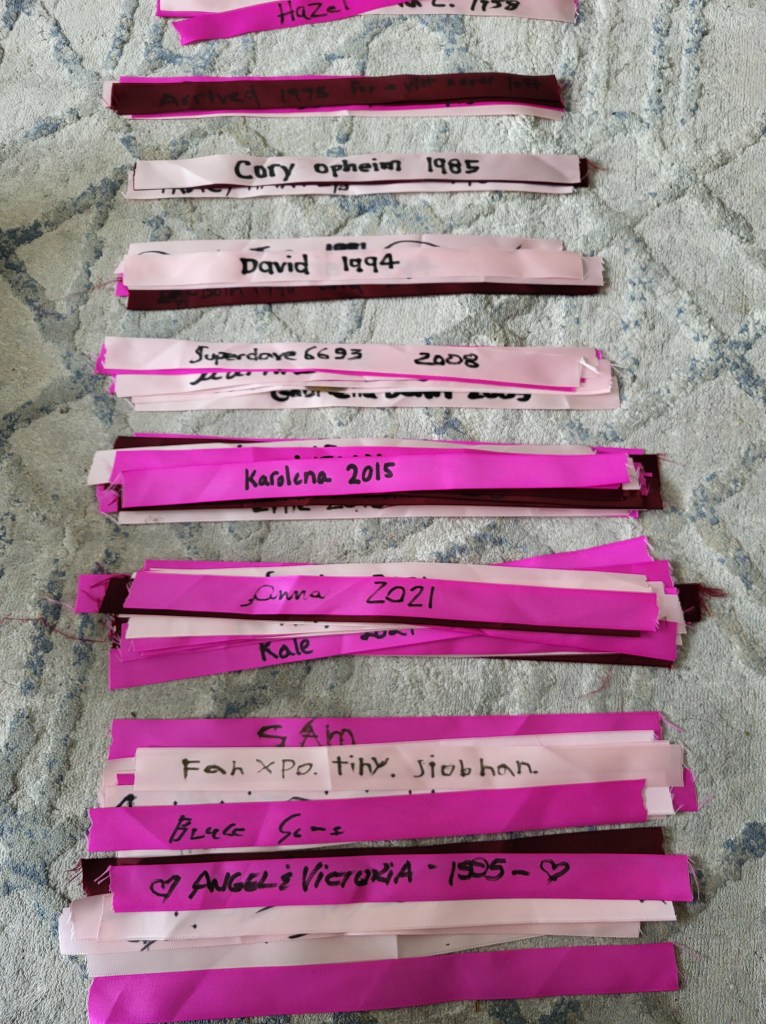
7. Arrival Patterns
In response to the question, “what decade did you arrive or were born in Nanaimo?” this metric measures responses from residents of Nanaimo who participated through an online survey or wrote their responses on ribbons. The ribbons have been wrapped around the corresponding cylinders.
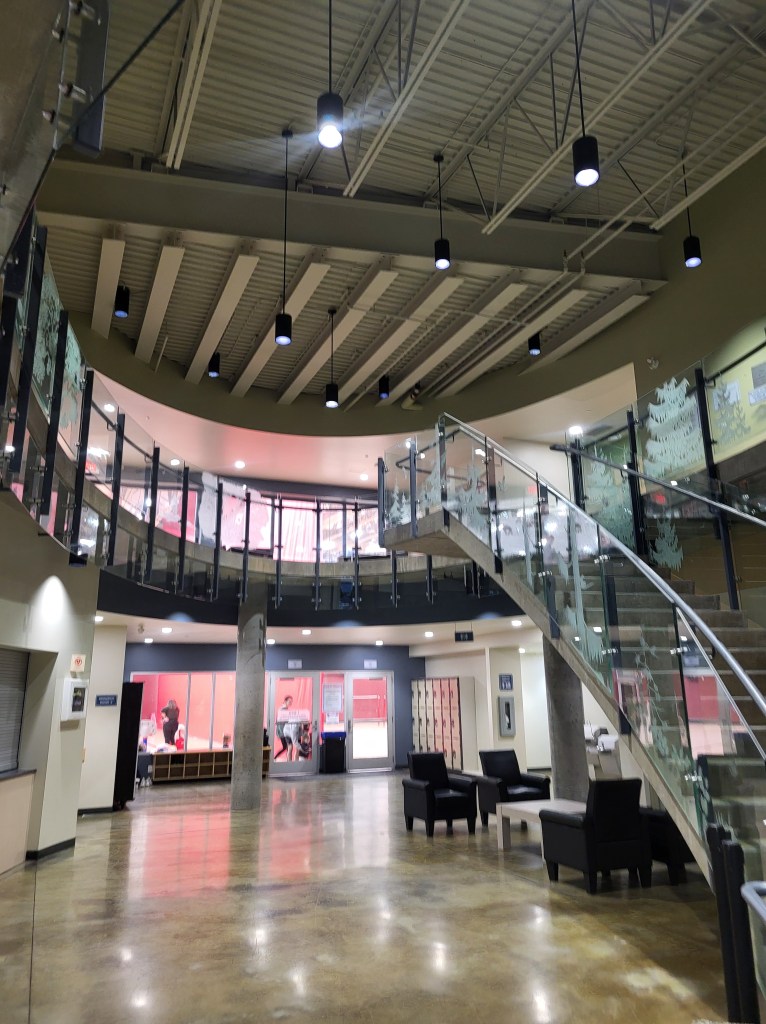
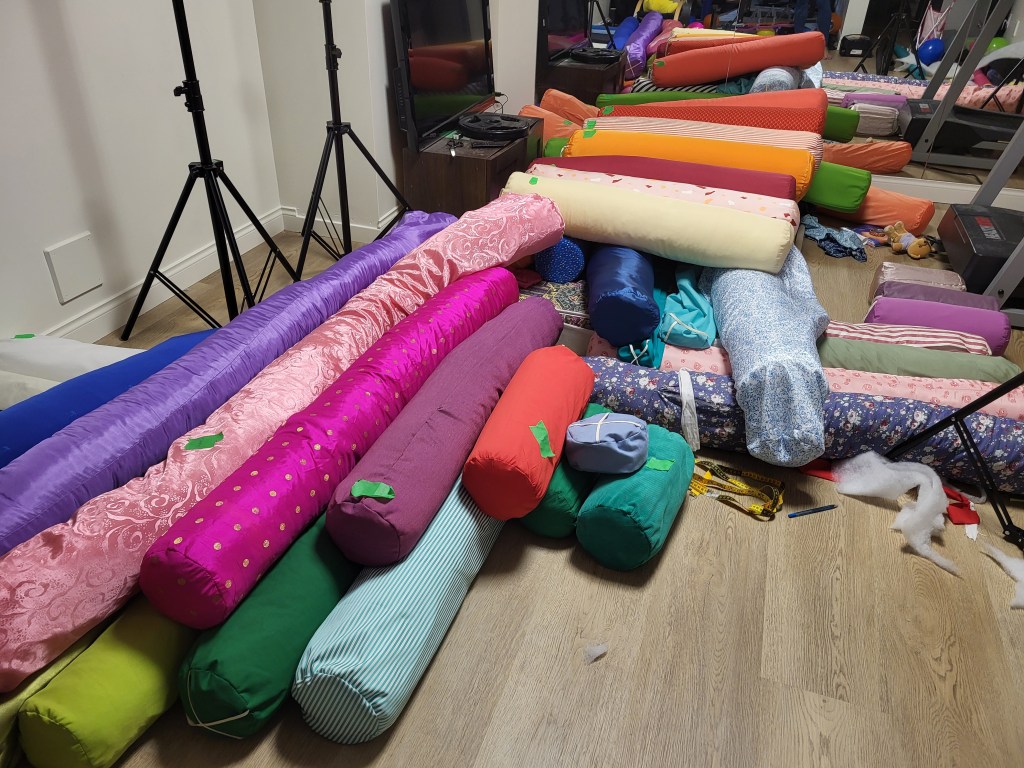
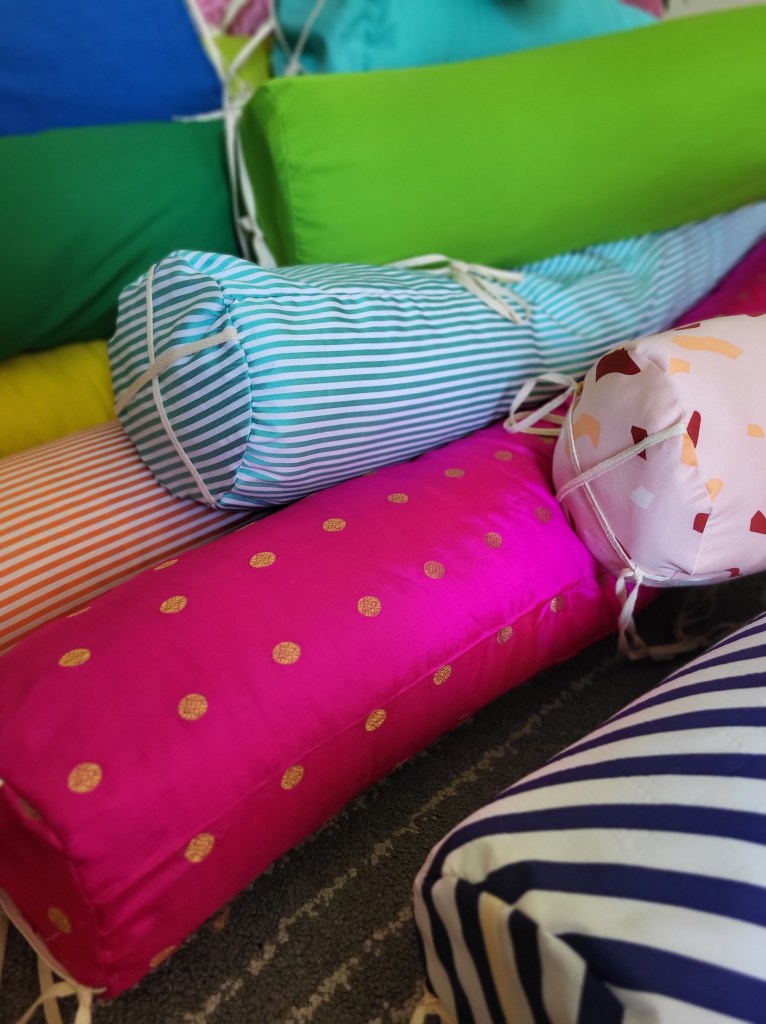
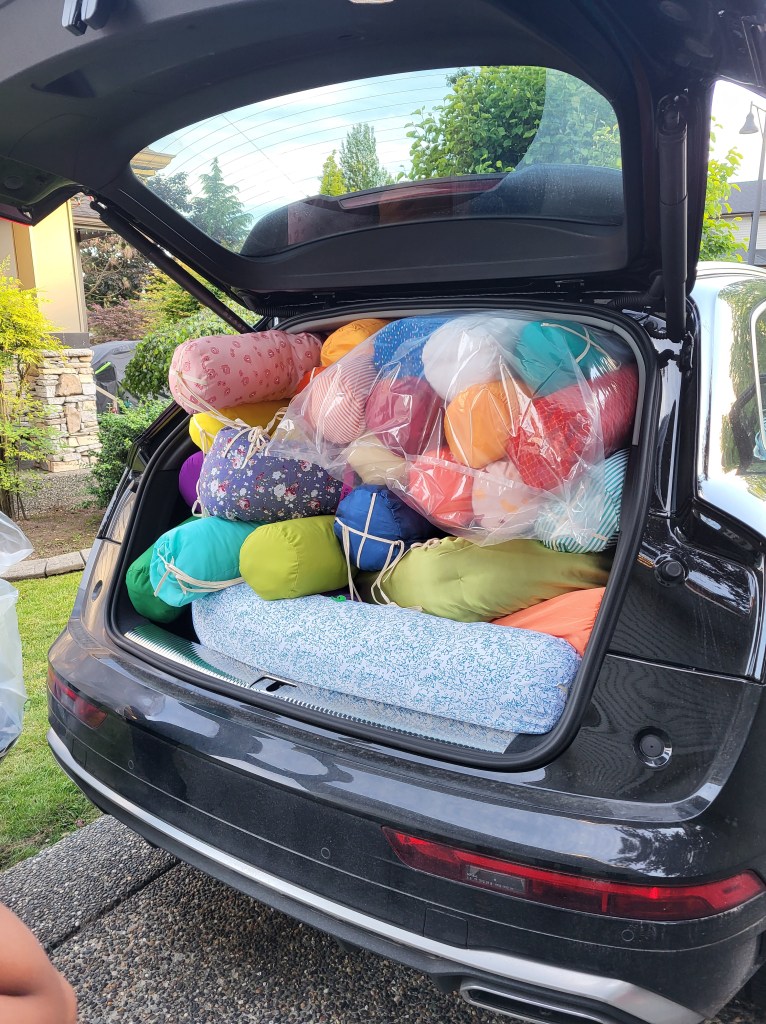
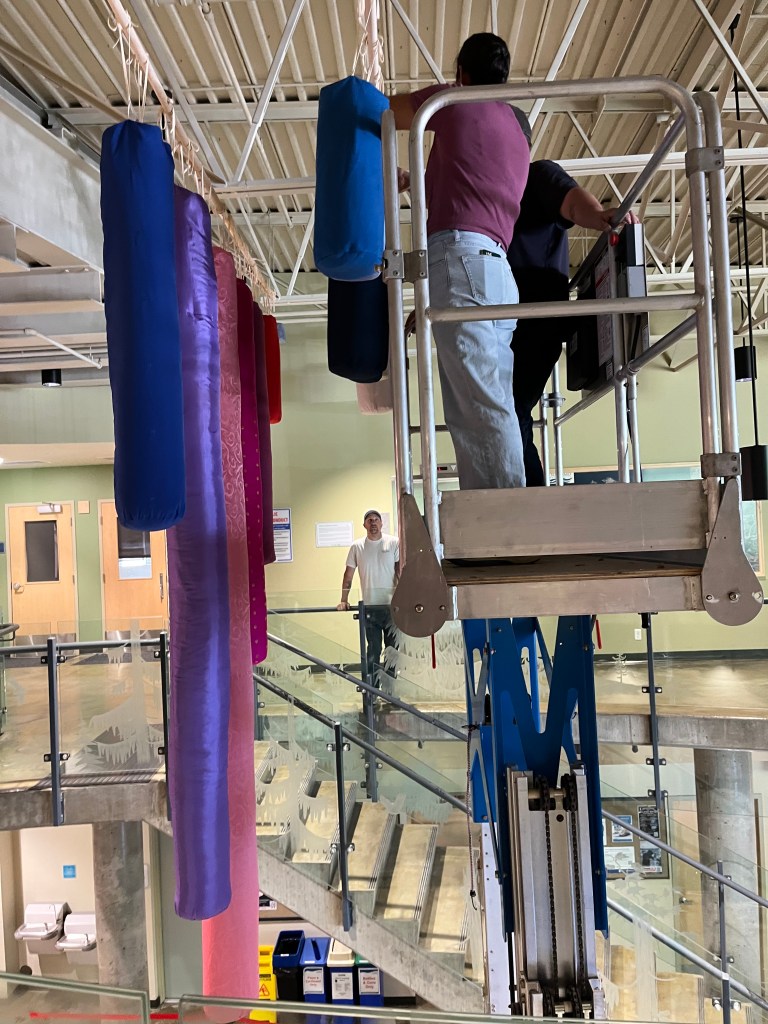
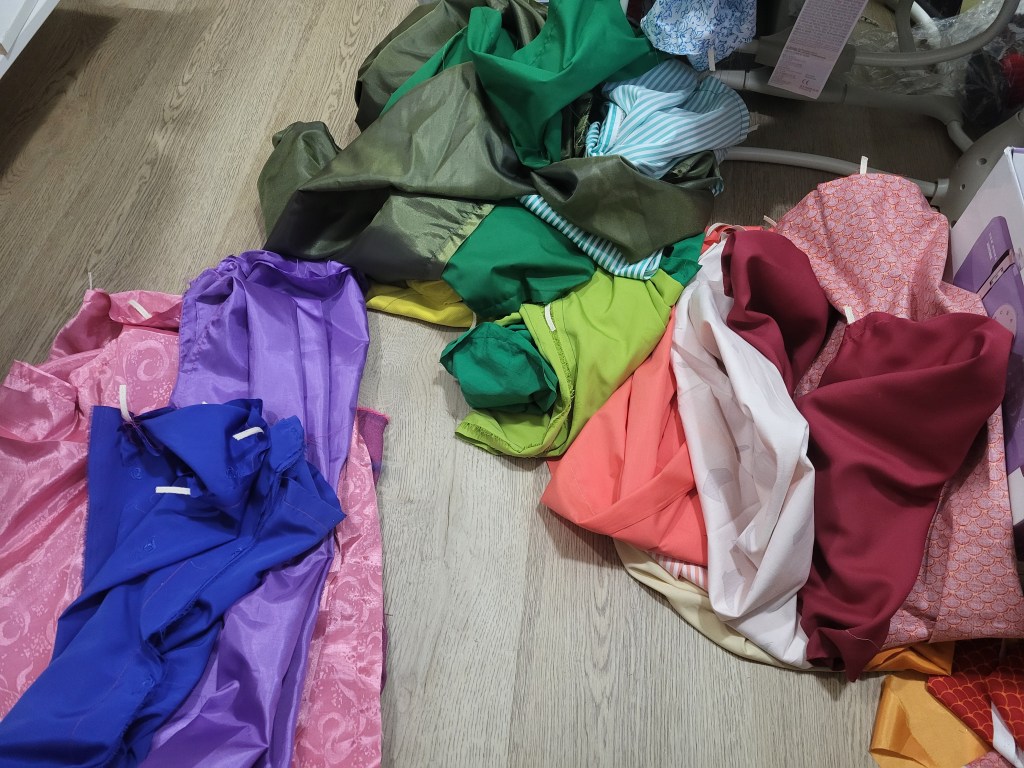
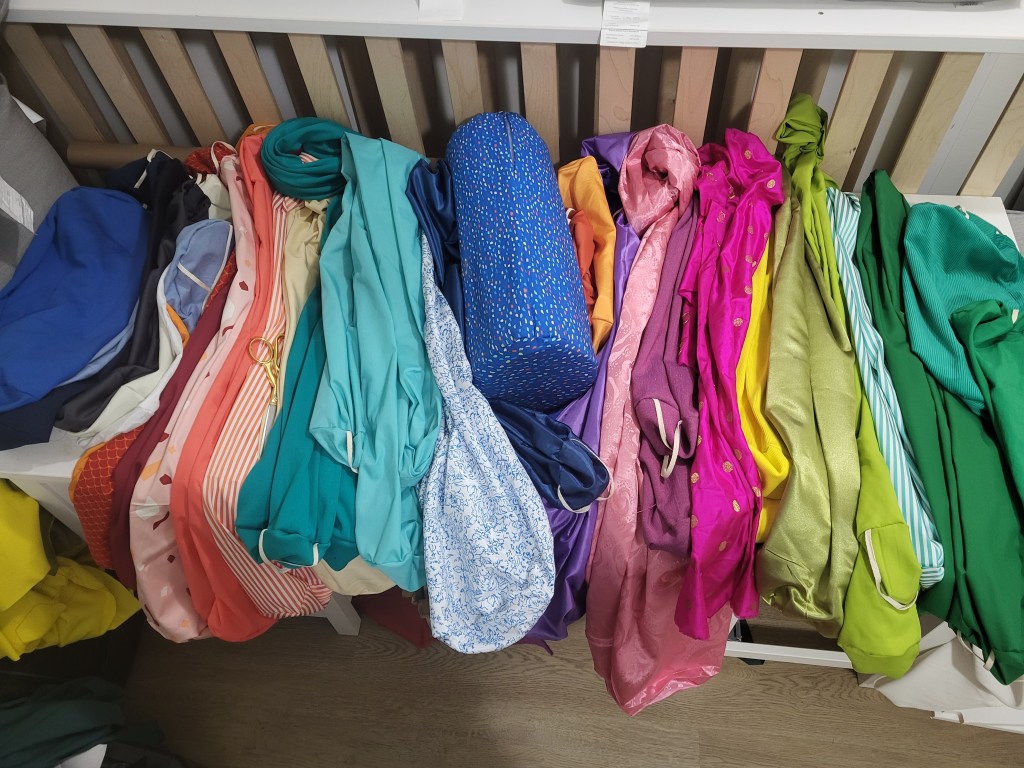
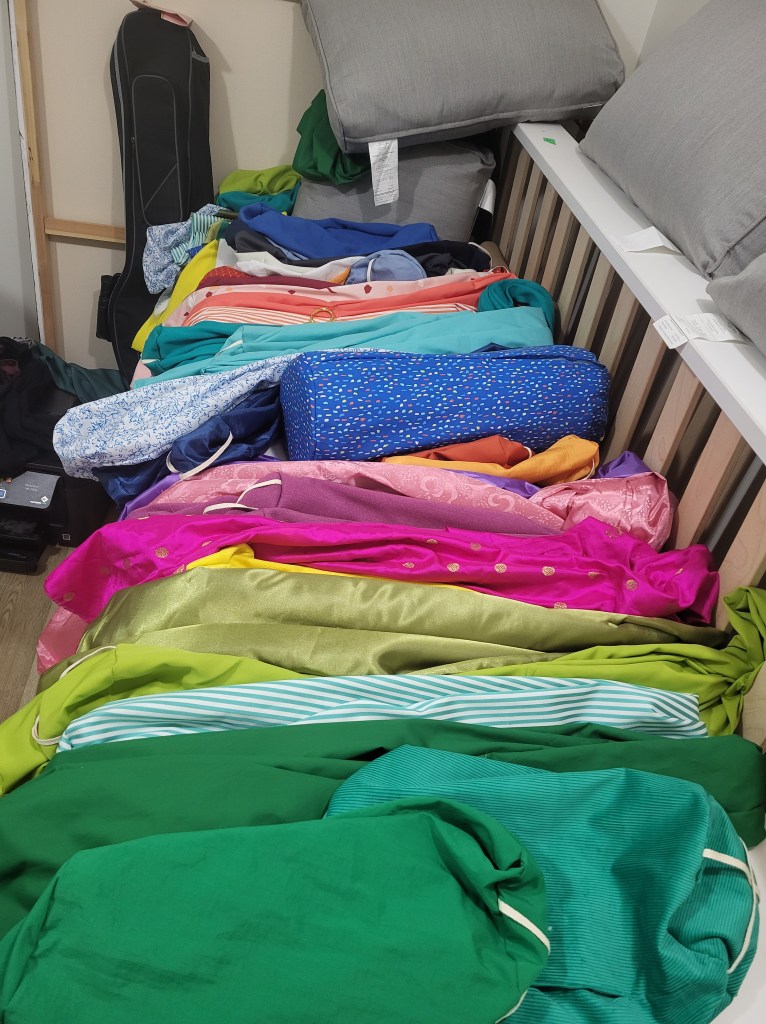
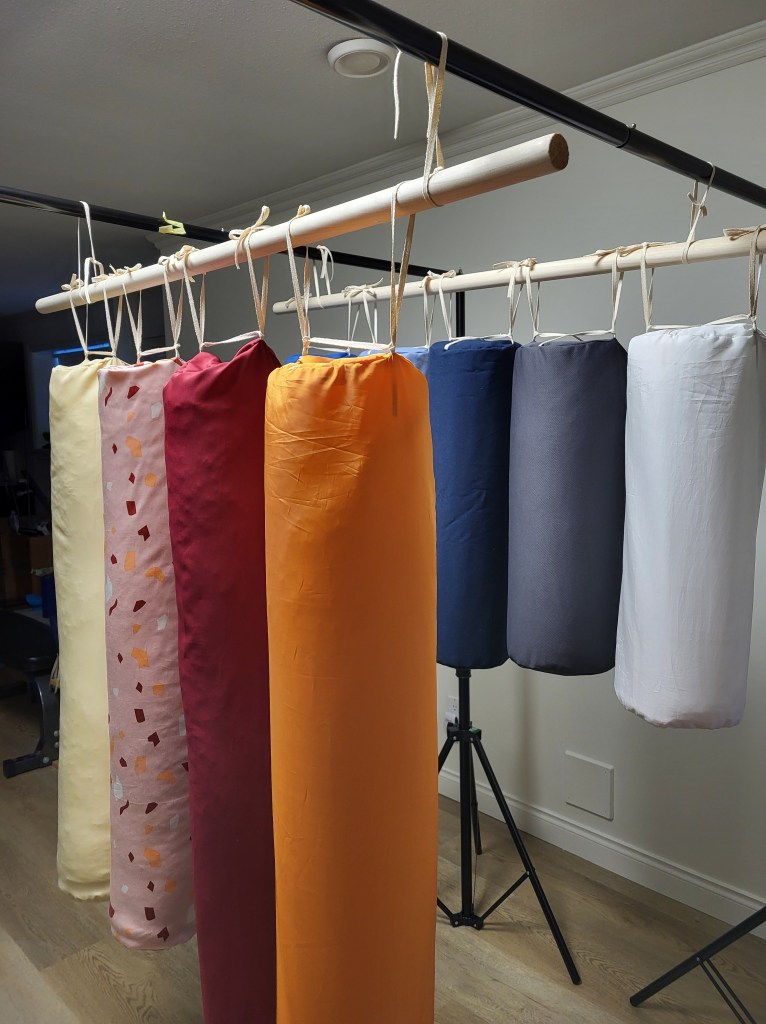
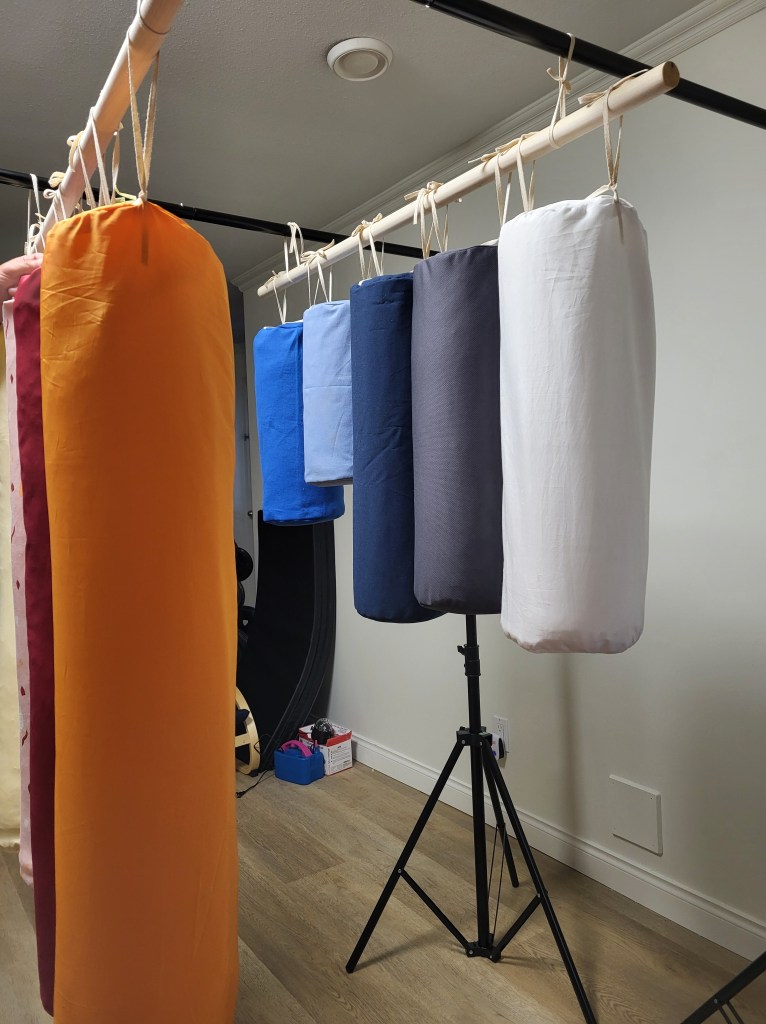
Production Details
Enjoy some photos from the production and installation process below!


Leave a comment